Key Findings from the 2023 Annual Progress Report for Vermont
1. Vermont has a responsibility to do our part
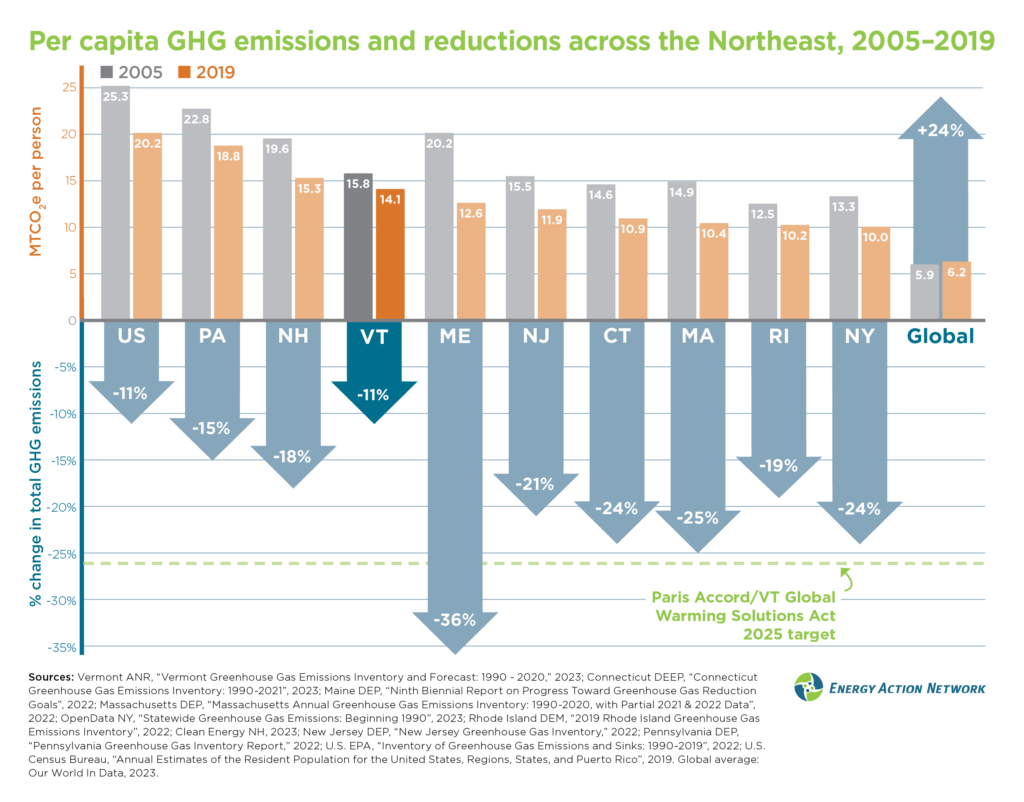
Vermont has the second highest per capita greenhouse gas (GHG) emissions in all of New England, behind only New Hampshire. Extending the comparison to the entire Northeast, Vermont’s per capita emissions are the 3rd highest, behind only New Hampshire and Pennsylvania.¹
Looking globally, Vermont’s per capita climate pollution (about 14 tons of carbon dioxide equivalent, or CO2e) is more than twice as high as the global average, and significantly higher than from residents of many other countries, including China (9.6 tons CO2e per person) and India (2.4 tons CO2e per person).² Vermont also has far higher cumulative historical per capita emissions than most other places around the world, given that Vermonters have been intensively using fossil fuels for over 150 years.
Vermont has made the least progress toward the Paris Climate Accord targets of any state in the region. That said, each state started from a different baseline, presenting different opportunities for progress. For instance, a significant factor in Maine’s emissions decline has been reductions in high-carbon fossil fuel use in their electricity sector. Vermont had less opportunity to achieve reductions in the same way, because our electricity portfolio was much less carbon intensive to begin with. Nevertheless, to meet Vermont’s legal obligations and our global responsibility, much more is required of us now and going forward.
2. Vermont is not on track to meet legal GHG obligations without additional policy action
Vermont’s Global Warming Solutions Act (GWSA) of 2020 established legal obligations for statewide GHG emissions reductions by 2025, 2030, and 2050. The latest data from the Vermont Agency of Natural Resources’ Greenhouse Gas Inventory and Forecast (Vermont’s GHG Inventory) show that Vermont’s emissions stood at 7.99 million metric tons of carbon dioxide equivalent (MMTCO2e) in 2020, equivalent to burning nearly 900 million gallons of gasoline.³
2020 was an outlier year for Vermont’s transportation-related GHG emissions, with a 15% decline compared to 2019 caused by reduced vehicle travel due to the pandemic, beginning in March 2020. However, initial data suggest that gasoline and diesel sales increased by about 8.5% from 2020 to 2021,⁴ so a partial rebound in transportation emissions will become apparent in future inventories — and it is very likely that this will contribute to 2021 emissions being higher than 2020 emissions.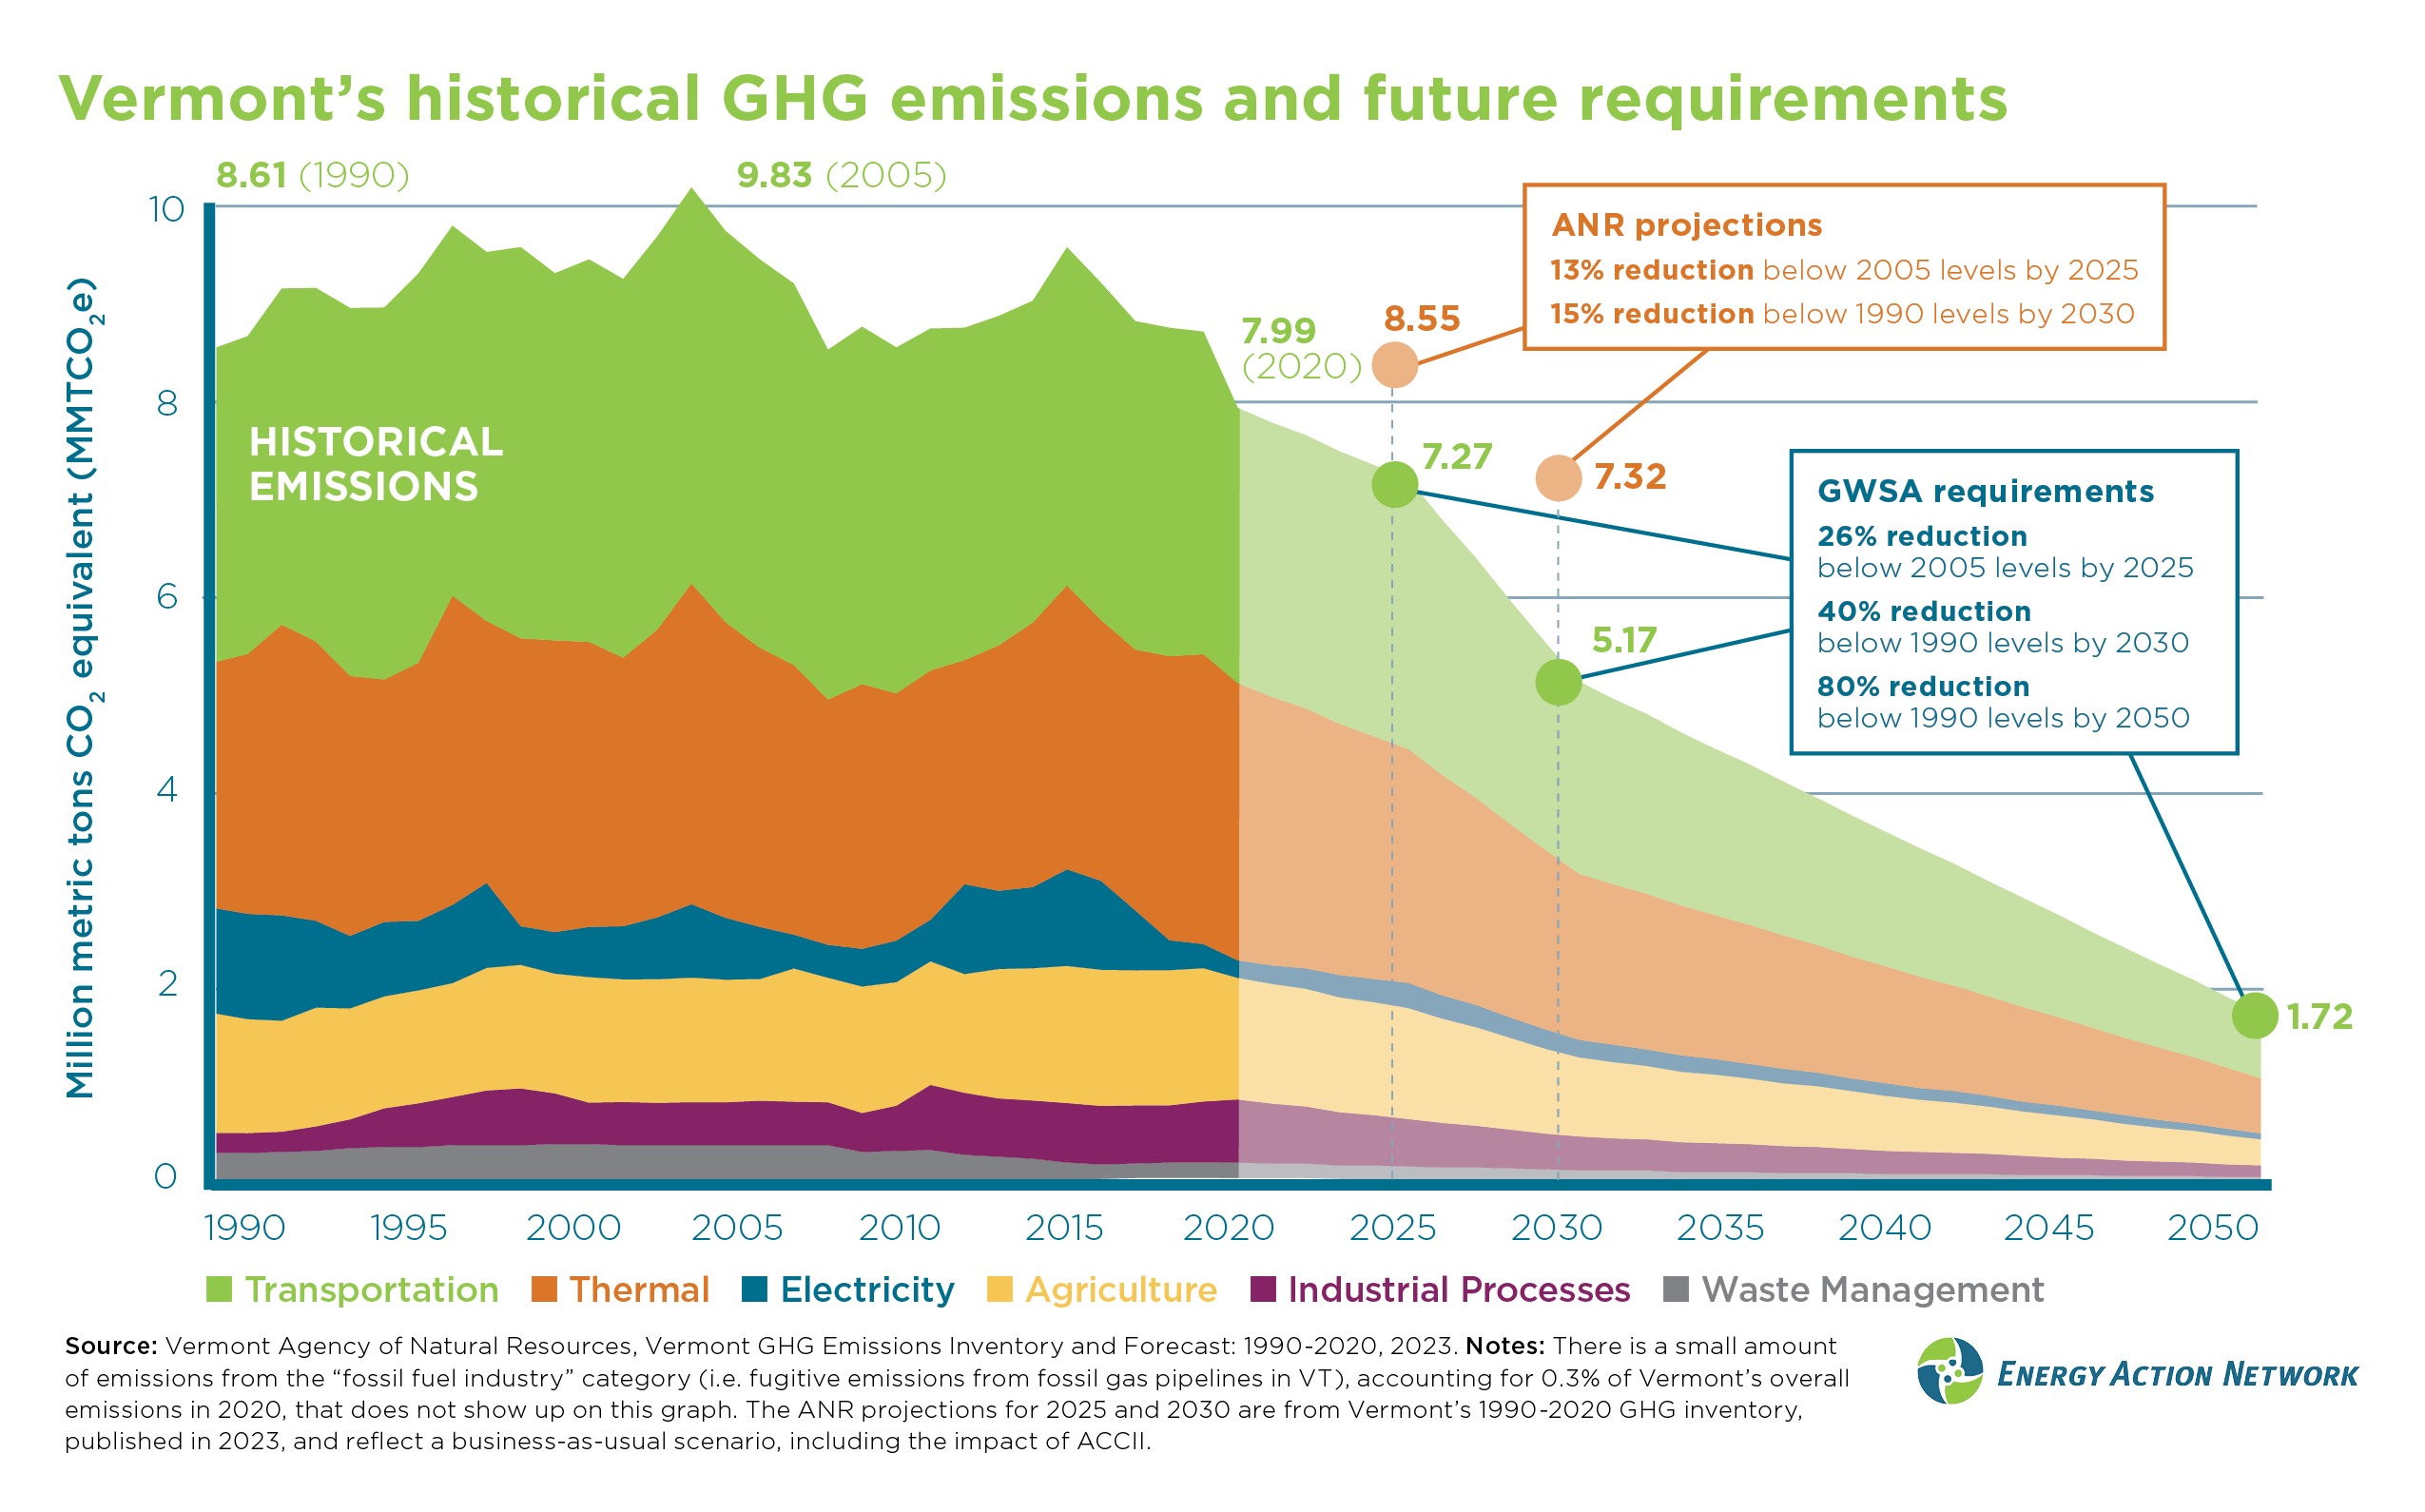
Vermont’s GHG Inventory also included a forecast for statewide emissions in 2025 and 2030, attempting to take into account business-as-usual projections, including the anticipated impact of the recently adopted Advanced Clean Cars II and Advanced Clean Trucks rules.⁵ Although there is uncertainty in forecasting, Vermont’s GHG Inventory shows significant gaps between projected emissions and our legal obligations for both 2025 and 2030.
However, modeling done for the Vermont Climate Council shows that meeting our 2025 and 2030 legal obligations is possible given current technology — but not without additional policy action and investment.
3. Thermal and transportation emissions are Vermont’s largest sources of climate pollution
For the first time in the history of Vermont’s GHG inventory, thermal sector emissions surpassed transportation emissions as the largest source of climate pollution in 2020. While this is a somewhat temporary effect related to the pandemic, thermal sector emissions are projected to make up an increasing share of Vermont’s climate pollution in a business-as-usual scenario, and to significantly surpass the transportation sector as Vermont’s leading source of GHG emissions by 2030.
The transportation sector has historically been Vermont’s largest source of climate pollution, followed by the thermal sector. However, in 2020, GHG emissions from the two sectors were essentially the same. Looking ahead to 2030, ANR projects thermal emissions to be significantly higher than transportation emissions (primarily due to expected declines in transportation emissions by virtue of the Advanced Clean Cars II rules and increased EV adoption). However, if the Clean Heat Standard is fully implemented in 2026, thermal sector emissions would be expected to decline to approximately 1.72 MMTCO2e by 2030, significantly lower than the projected 2030 transportation sector emissions.⁶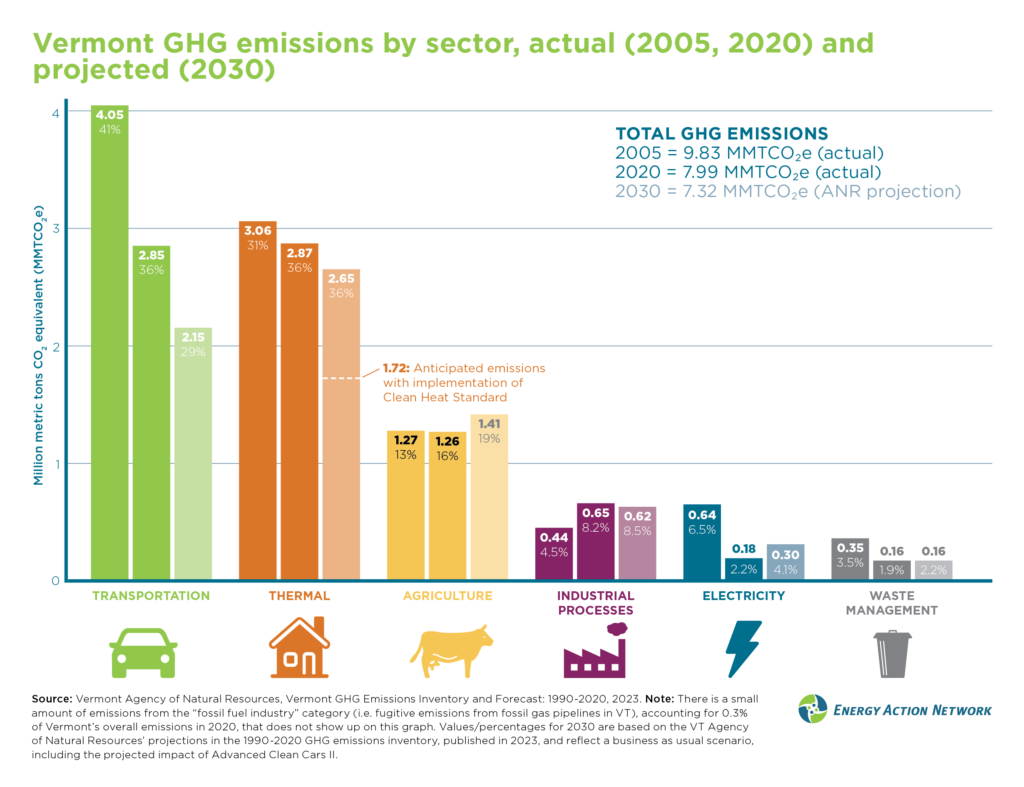
4. Vermonters with lower incomes are disproportionately burdened by energy costs
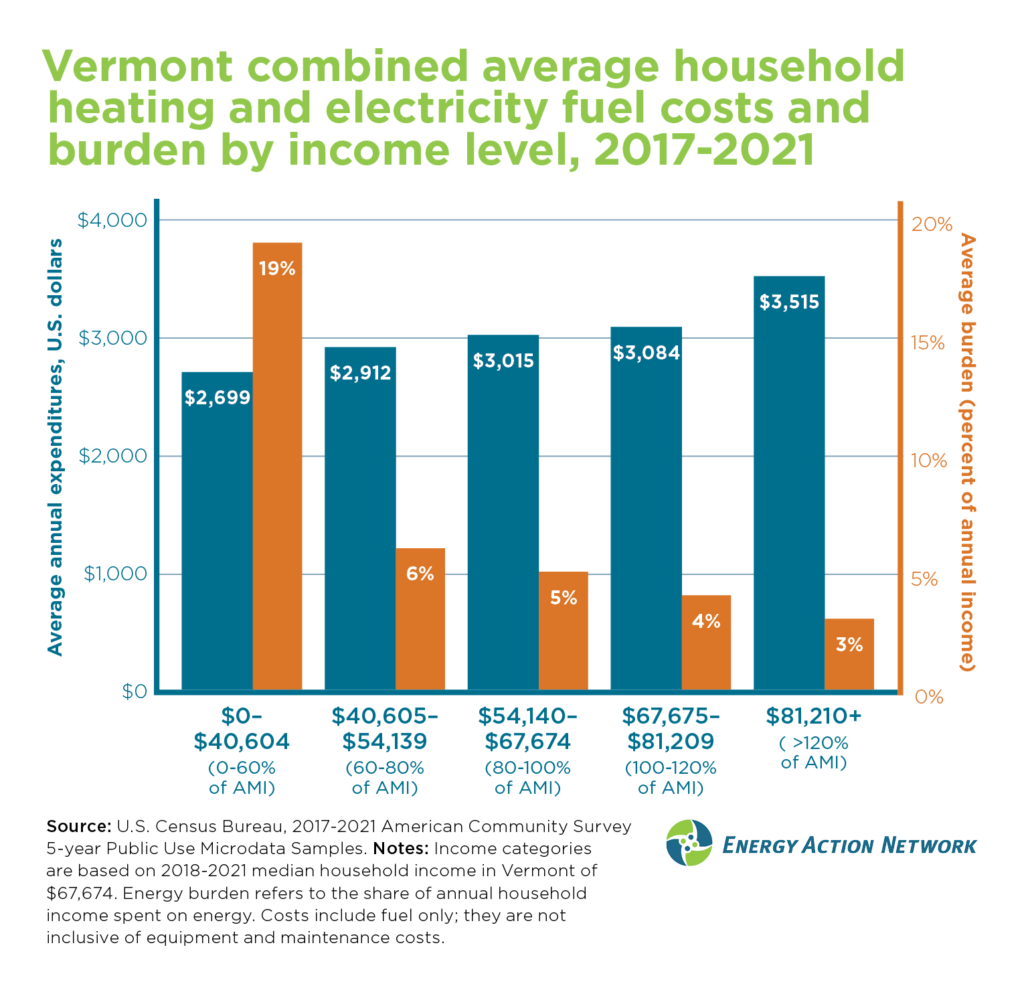
Vermont households with lower incomes typically use less energy than those with higher incomes. Nevertheless, households with lower incomes, on average, face far higher energy burdens, meaning they spend a larger share of their income on energy.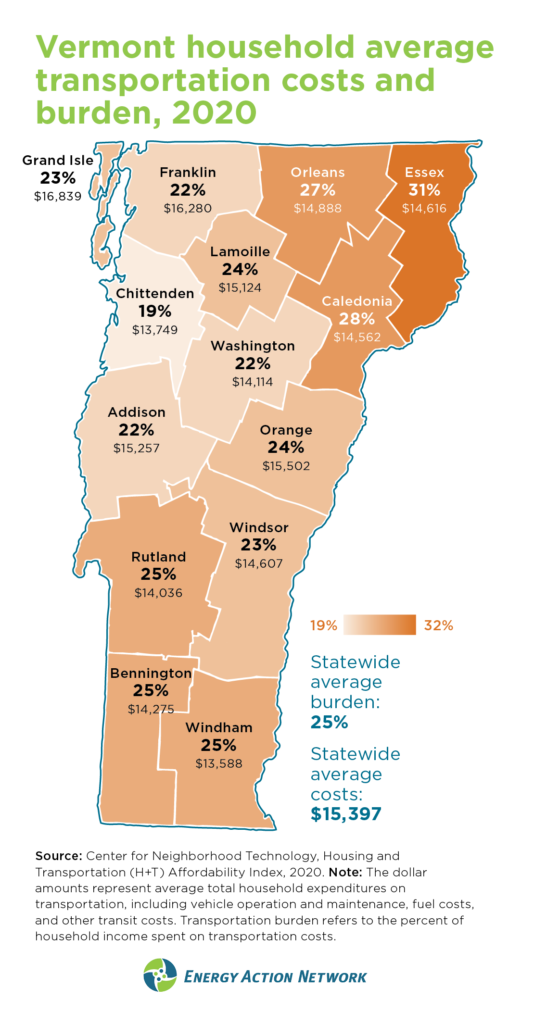
In the transportation sector, where we have the data to look at the “all-in” costs, including vehicle purchase, fuel, and maintenance, we can see that there is a significant geographic disparity in transportation energy burden throughout the state, with higher burdens in the Northeast Kingdom and Southern Vermont. Averaged across Vermont, households with lower incomes (80% of the area median income, or AMI) spend, on average, 30% of their income on these “all-in” transportation costs, compared to 25% for Vermonters at the state median income.
When looking at the combined average costs for heating fuel and electricity (without the associated equipment and maintenance costs, for which data are not available), the disparity in energy burden is especially pronounced between households with the lowest incomes, which spend 19% of their income on these fuels on average, and households at and above 100% of AMI, which spend 4% or less of their income on these energy sources.
High energy burdens increase the risk of transitioning into poverty or of experiencing long-term poverty by 150-200%.⁷ Higher energy burdens are also correlated with “greater risk for respiratory diseases, increased stress and economic hardship, and difficulty in moving out of poverty.”⁸
5. Relying on fossil fuels is a drain on Vermont’s economy
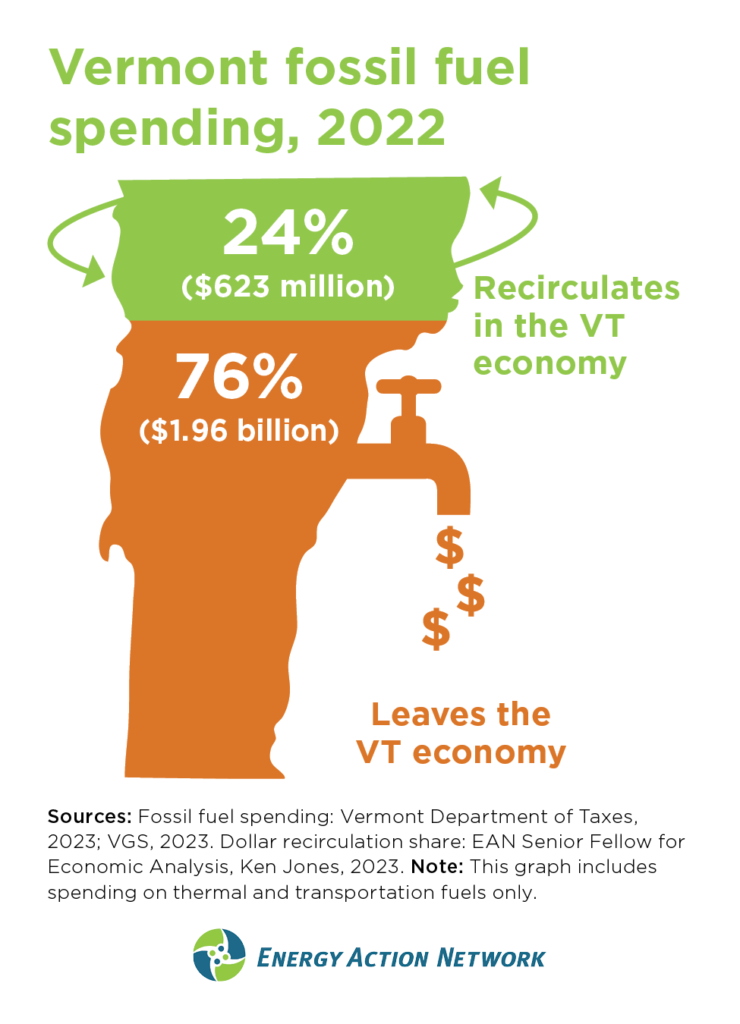
100% of the fossil fuels used in Vermont are imported from out of state. More than three quarters of the money we spend on fossil fuels drains out of the state economy. In 2022 alone, nearly $2 billion of the approximately $2.6 billion in total fossil fuel spending in Vermont left the state economy.
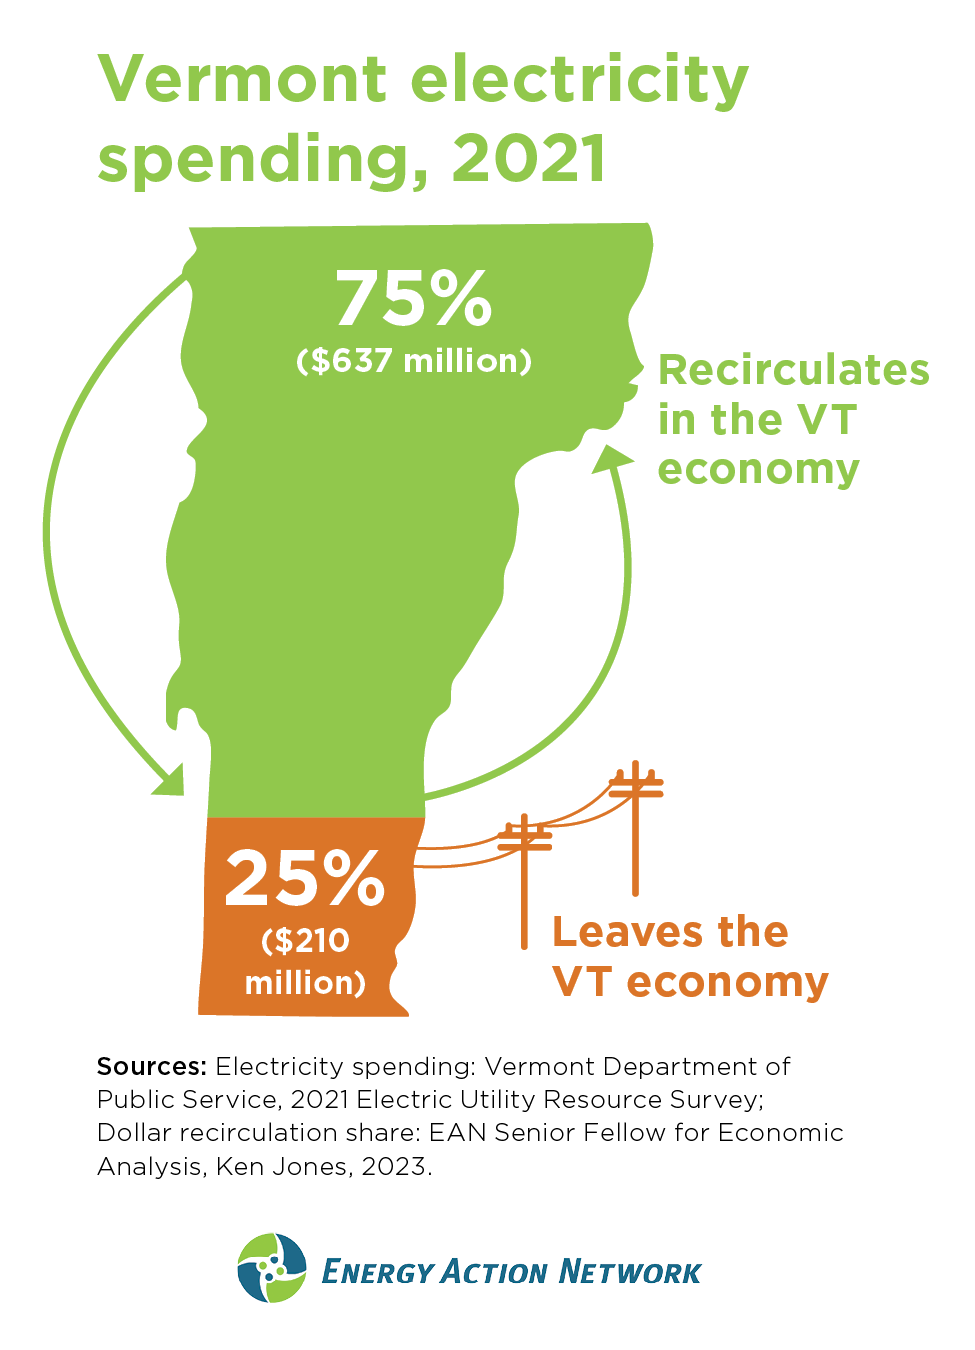
The ratio is essentially reversed when we use electricity to meet our energy needs. For example, by driving electric cars or heating with high-efficiency electric heat pumps, 75% of the dollars we spend stay and then recirculate in Vermont. This is because most of the cost of delivering electricity is bound up in local labor and infrastructure, whereas most of the cost of fossil fuels goes to importing a global commodity product. Using electricity instead of fossil fuels creates a positive feedback loop that strengthens Vermont’s economy, helping support working families by paying the salaries of Vermont lineworkers, tree-trimmers, and local clean power producers, among others.
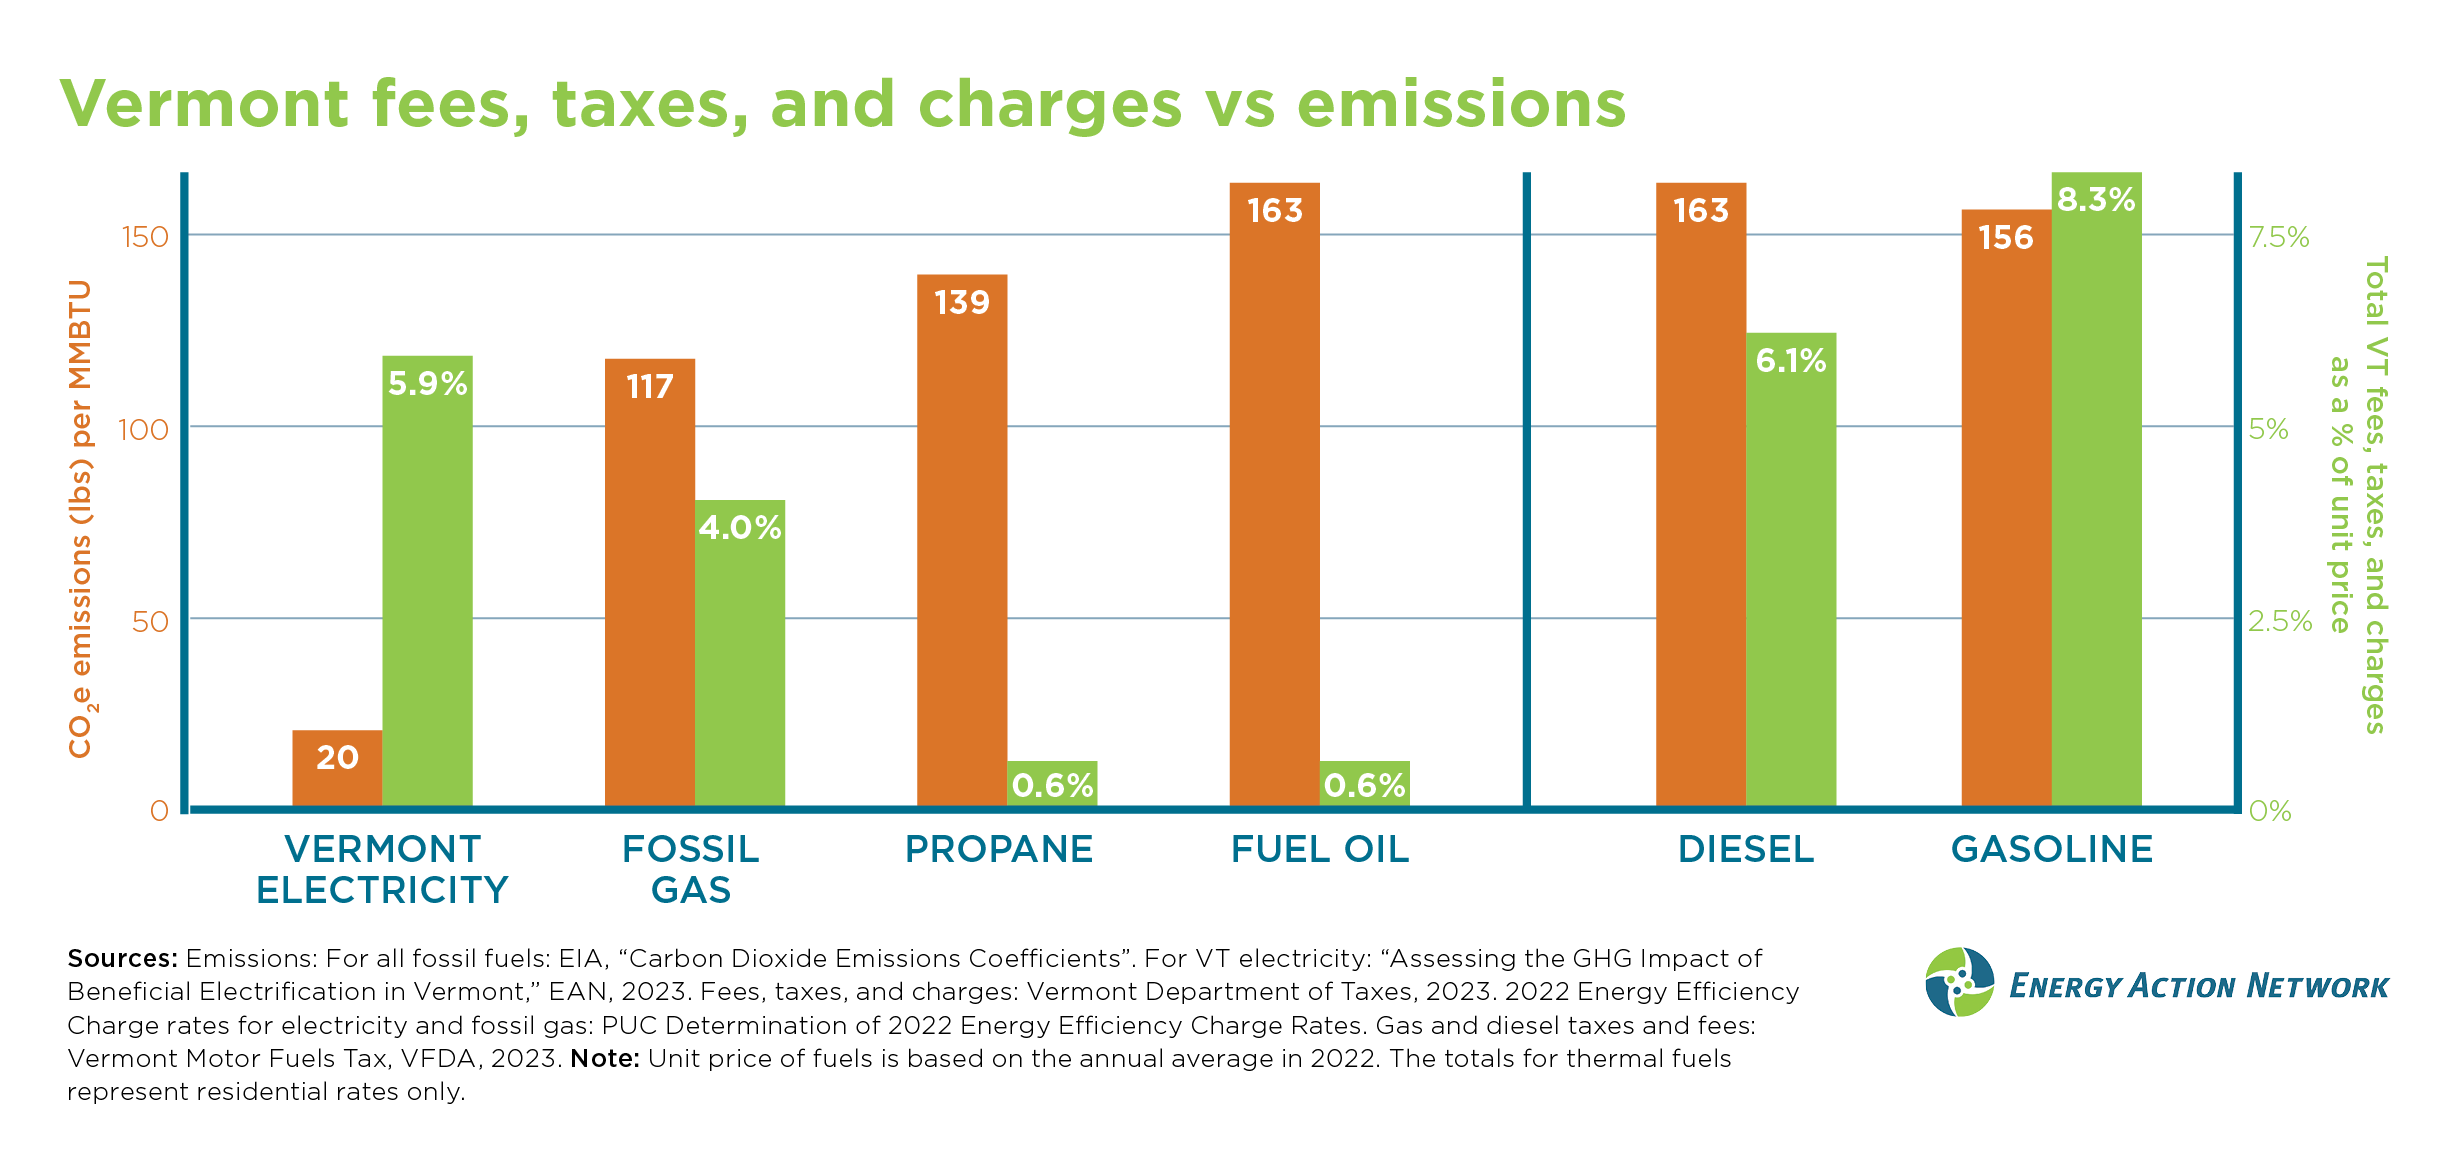
Vermont doesn’t require fossil heating fuels to contribute as much in fees and taxes as electricity (or as much as fossil fuels used for transportation), despite the fact that fossil fuels are such a drain on Vermont’s economy and produce far more climate pollution than Vermont’s electricity portfolio.
6. Meeting Vermont’s climate commitments requires a larger climate workforce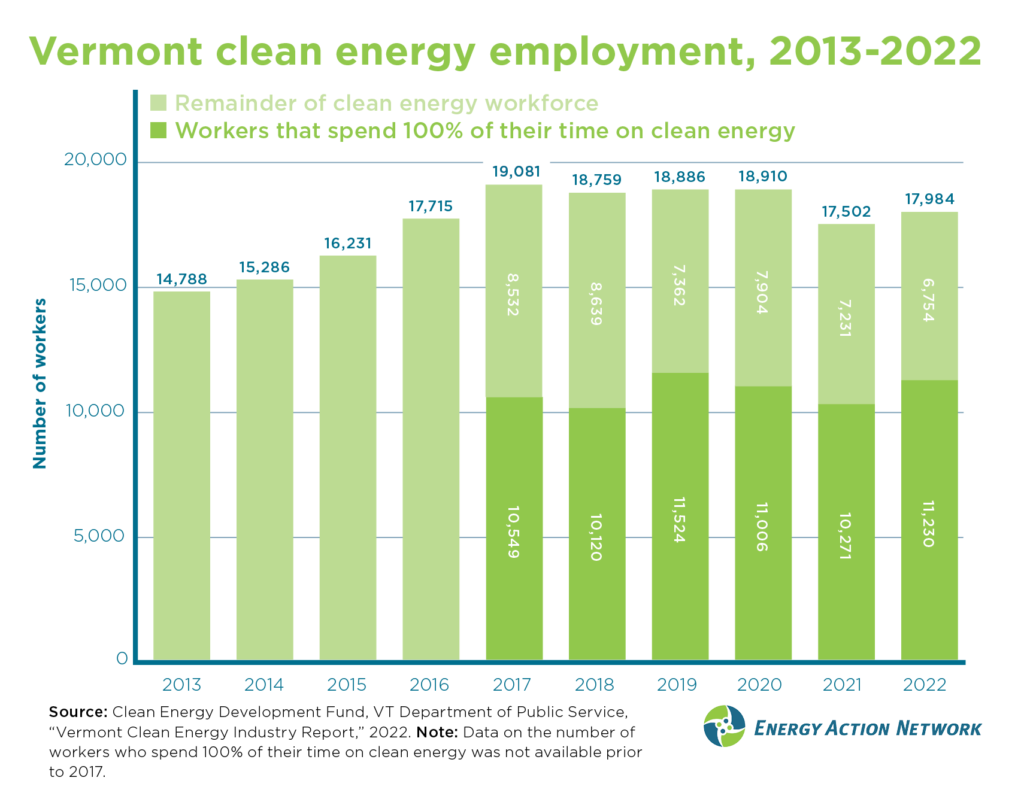
To meet Vermont’s obligation to cut climate pollution we will need to recruit and train an expanded clean energy and climate workforce — while also supporting and retaining existing workers and employers. As of 2022, there were about 19,400 Vermonters in the climate workforce, almost 18,000 of whom were clean energy workers, working in fields such as weatherization, installing and maintaining greener heating and transportation technologies, and deploying and maintaining renewables. In fact, Vermont has the highest share of workers in the clean energy sector, per capita, in the country.⁹ Beyond the clean energy workforce, approximately 1,400 additional climate workers in Vermont are employed in agriculture and land management, waste management, public transit, education, financing and philanthropy, and selling and servicing efficient electric equipment.¹⁰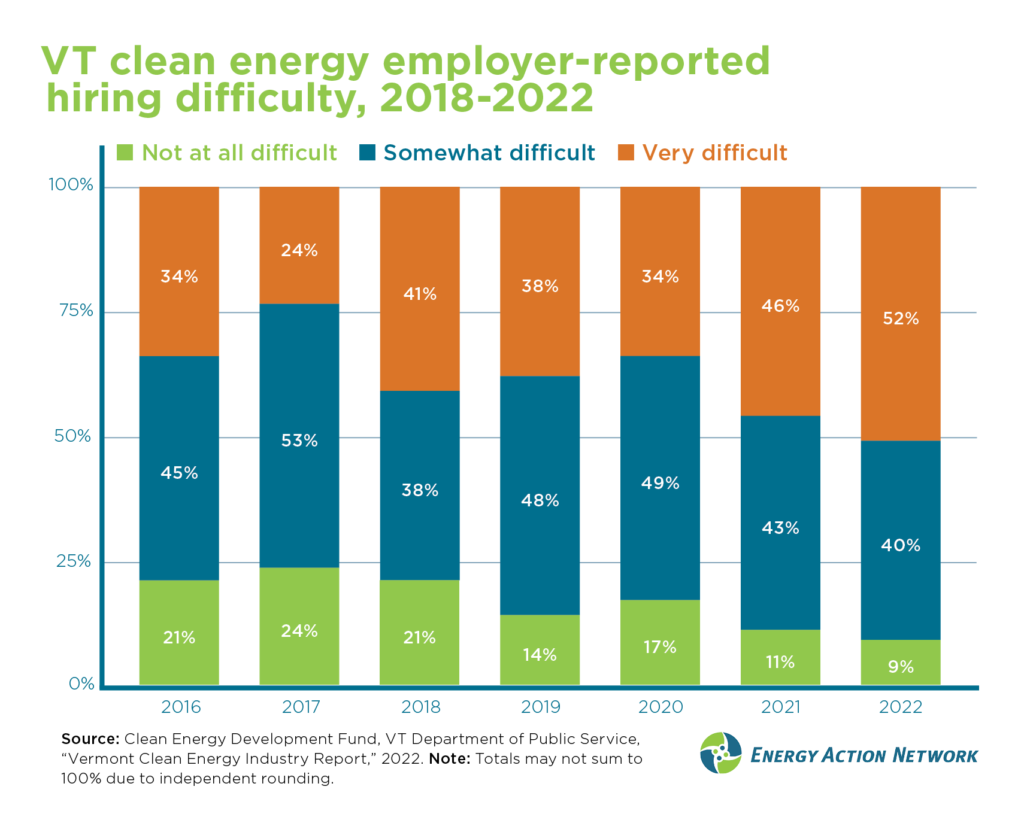
Employment in Vermont’s clean energy sector grew annually between 2013 and 2017, and then remained relatively steady until the pandemic led to a reduction in employment across the economy. As of 2022, Vermont had not yet returned to our 2017 peak of clean energy employment.
Vermont’s clean energy employers have been encountering increasing difficulty in hiring workers over the past few years. As of 2022, more than half of Vermont clean energy employers said that it was “very difficult” to hire new workers, with only 9% reporting that it was “not at all difficult.”
Read the full 2023 Annual Progress Report for Vermont here.
Sources:
- EAN, “Assessing Vermont’s climate responsibility: A comparative analysis of per capita emissions,” 2023.
- Gütschow, J. & Pflüger, M., “The PRIMAP-hist national historical emissions time series v2.4 (1750-2021)”, 2022 via Climate Watch.
- U.S. EPA Greenhouse Gas Equivalencies Calculator.
- Vermont Legislative Joint Fiscal Office, 2023.
- Vermont Agency of Natural Resources, “Supplemental Information for Vermont’s Low Emission Vehicle and Zero Emission Vehicle Proposed Rules,” 2022.
- Note: The Affordable Heat Act was passed in 2023 and begins the process of establishing a Clean Heat Standard in Vermont. This law is designed to reduce GHG emissions in the thermal
sector by establishing requirements for importers of fossil heating fuels into Vermont. - Jeremiah Bohr and Anna C McCreery, “Do Energy Burdens Contribute to Economic Poverty in the United States? A Panel Analysis.” Social Forces, 2019.
- ACEEE, “How High Are Household Energy Burdens,” 2020.
- Clean Energy Development Fund, VT Department of Public Service, “Vermont Clean Energy Industry Report,” 2022.
- EAN Climate Workforce Network Action Team, 2022.
